Example for Using Tribal-FERST to Map Environmental Issues
Tribal-FERST can be used to map a variety of environmental issues in a community.
Please scroll down to see the text at the bottom of the photograph and click on “Next>” to advance the slides.

Slide 1
To address health issues in a community, it is sometimes necessary to explore how a variety of different issues may impact the health of people who live and work there.
In this example, we will show you how to map estimated benzene exposure, poverty, and the location of health care facilities in a community.
Estimated Benzene exposure is based on models that include meteorology and pollution sources, averaged over a year-long period. Benzene is a hazardous air pollutant regulated by EPA under the Clean Air Act. Poverty levels in this example are based on U.S. Census data.
Slide 2
In this example, low-income neighborhoods may not have as many financial resources to deal with health concerns from exposure to air pollutants and other environmental contaminants.
Additionally, some communities may not have healthcare facilities nearby in the event of a health problem. When considered together the combined result may highlight an area that has numerous factors that contribute to overall community health.
Slide 3
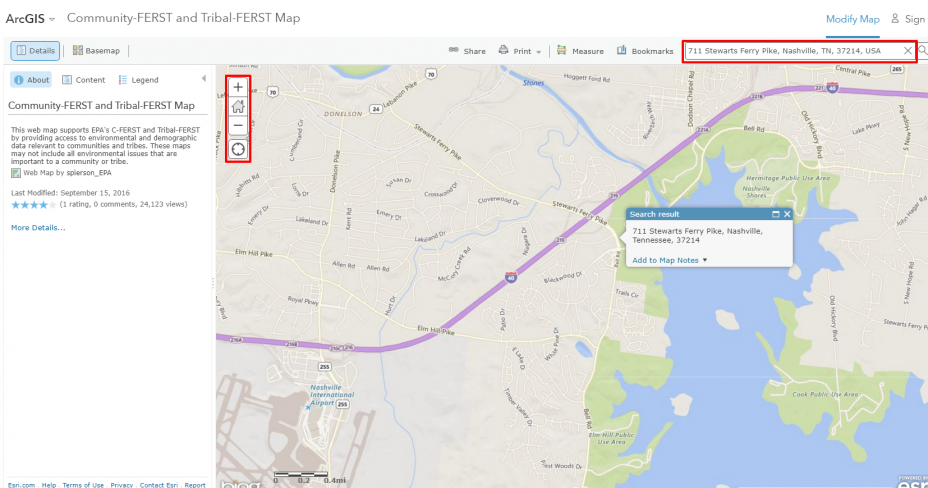
Once Tribal-FERST Maps is open, zoom into your location by typing the city name in the search box in the top right corner of the map. To adjust the zoom, use the plus and minus signs in the top left corner of the map. You can also move the map by clicking and dragging it to a specific location.
Slide 4
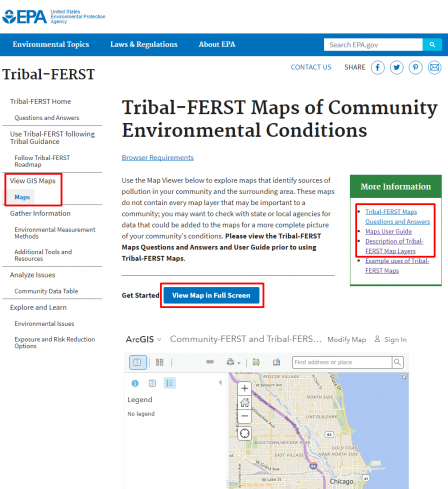
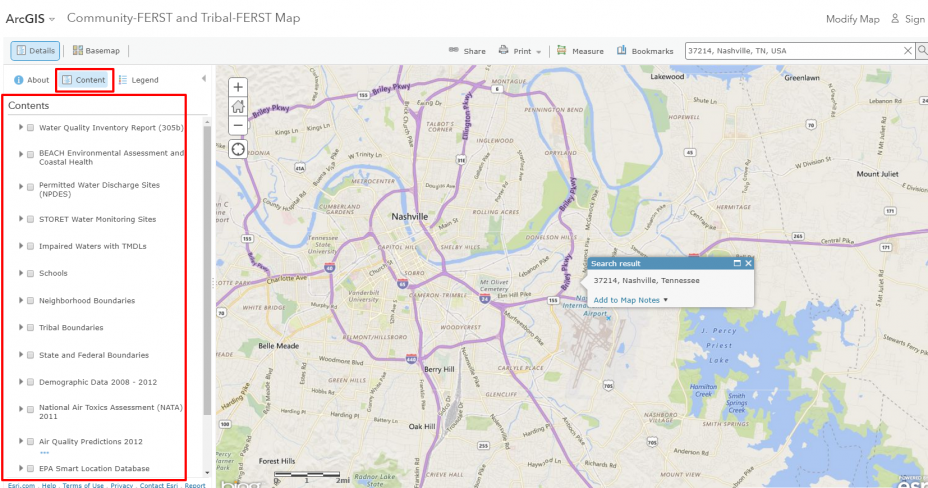
To show the data and information available on the Tribal-FERST map, click “Show Map Contents.”
This is the middle button under “Details.” “Show Contents of Map” provides a list of the types of information, or “layers,” that you can add to the map.
Slide 5
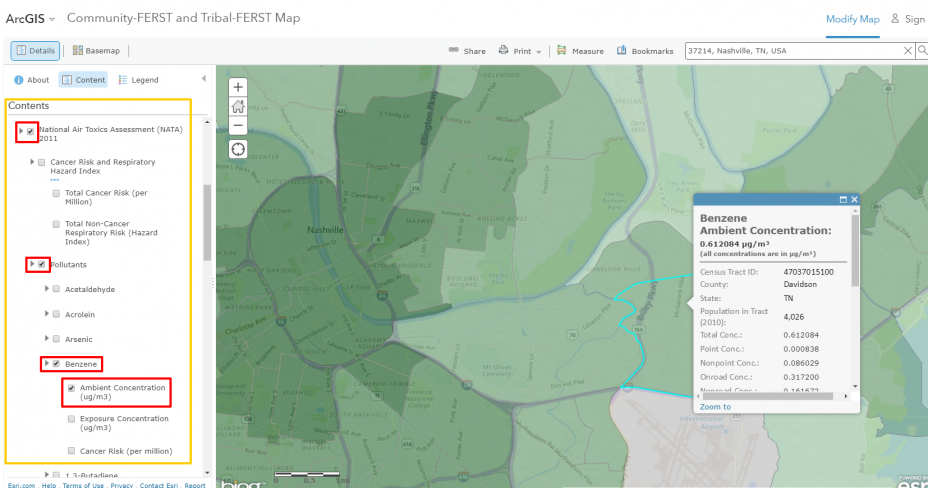
To display a map of estimated exposure to benzene in the outdoor air, click on the down arrow and the check box for the map layer called “National Air Toxics Assessment (NATA) 2011.”
A menu of several options appears. Click on the box next to “Pollutants” to turn on that layer. Next, select “Benzene” and under that, click on “Exposure Concentration.”
Please note: All of the check boxes must be selected for the layer to appear.
Slide 6
When layers such as “Ambient Concentration” are shown, you may not be to see some features on the underlying base map, like streets and names.
To view these features, adjust the map transparency by clicking the three dots underneath the parent layer (in this case “National Air Toxics Assessment (NATA) 2011”) to view a menu with the option to adjust the transparency.
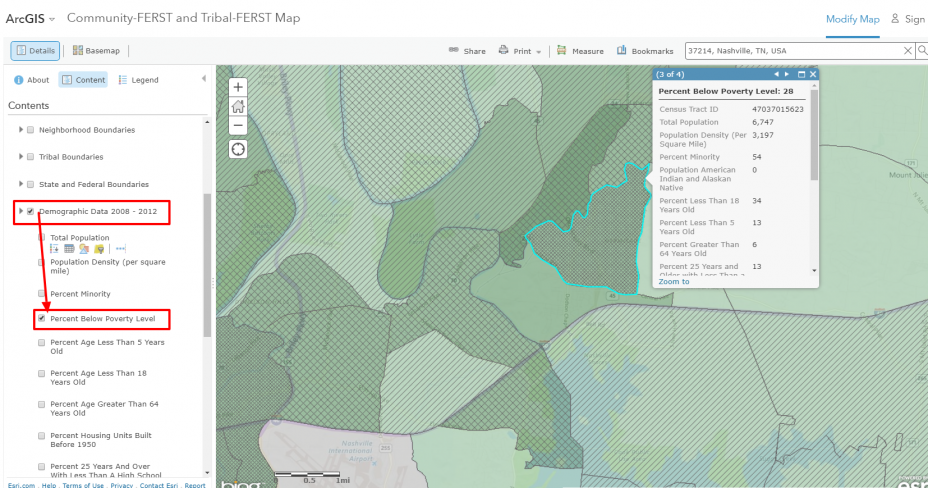
Slide 7
An important feature of Tribal-FERST is the ability to overlay multiple map layers.
For example, to add data on poverty to your map of estimated benzene exposure, select “Demographic Data 2008 – 2012” and then select “Percent Below Poverty Level.”
Click on the map to see the Percent Below Poverty Level for a specific area in a “pop-up.”
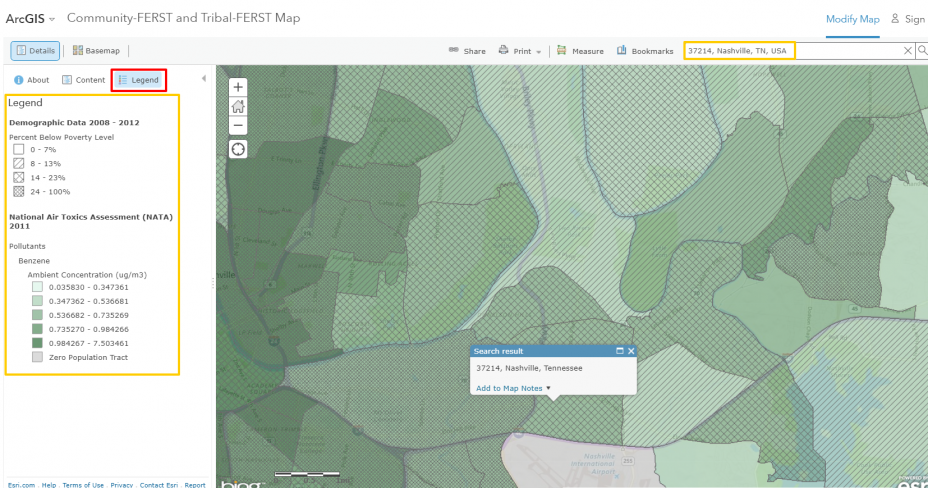
Slide 8
To see how each map layer is represented, click “Show Map Legend.” It is the third button under “Details.”
This displays the values of the different colors and patterns on the map and the units associated with them.
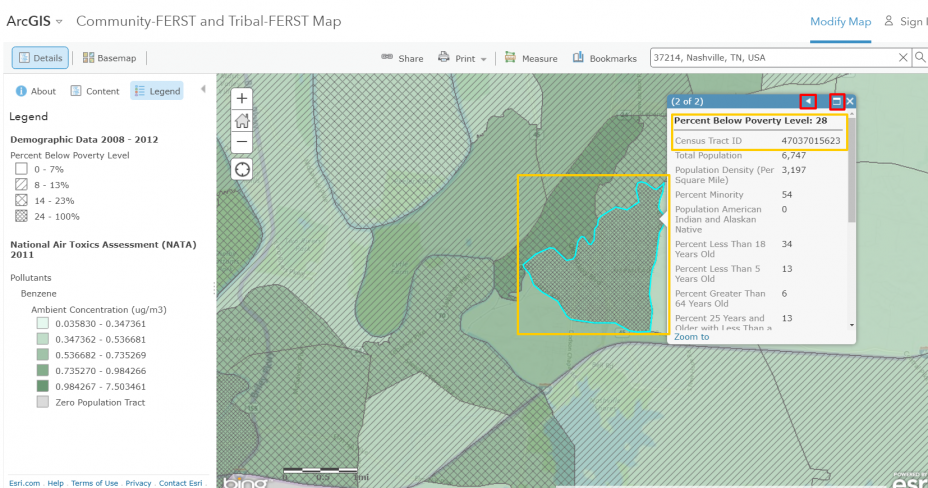
Slide 9
Click on an area of interest to view pop-ups with more information about the data displayed on the map. In this example, “Percent Below Poverty Level” is shown, and this specific census tract in Nashville, TN has 28% of residents living below the poverty level.
To enlarge the pop-up, click on the “Maximize” square on the top right side of the pop-up. Click on the little arrow next to that to switch between the different “layers” shown in the map.
To close the pop-up, click on the “X” next to the “Maximize” square.
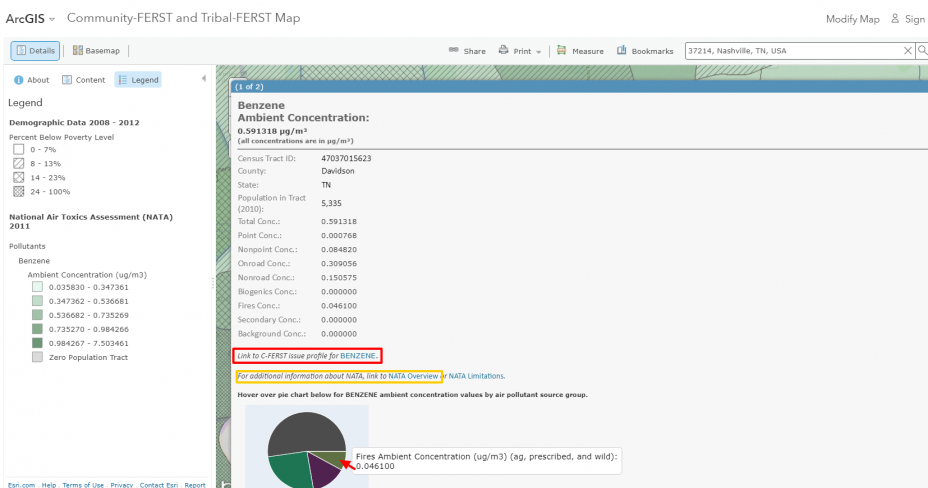
Slide 10
You can view pop-ups for each layer currently shown on the map.
For map layers like this one from the National Air Toxics Assessment (NATA), the pop-up contains estimates for exposure and a pie charts showing the source categories that contribute to the estimates. To see what the different slices represent, hover your cursor over the pie chart.
The pop-ups also show additional information about NATA, including important information about model limitations, and how to use and interpret model results. Some pop-ups have links to the C-FERST Issue Profiles, which provide links to useful information.
When you finish with this example, you can see other examples at
– View Maps of Your Community’s Environment Using Tribal-FERST
If you are ready to start using Tribal-FERST Maps:
– View Tribal-FERST Maps
Contact Us to ask a question, provide feedback, or report a problem.